
Real-Time Data, One Integrated PlatformIOPlatform is web-based software used to connect ControlByWeb devices in real-time into one integrated platform. Users are able to add remote ControlByWeb devices and associated sensors and fetch their real-time data into one single platform. |
 |
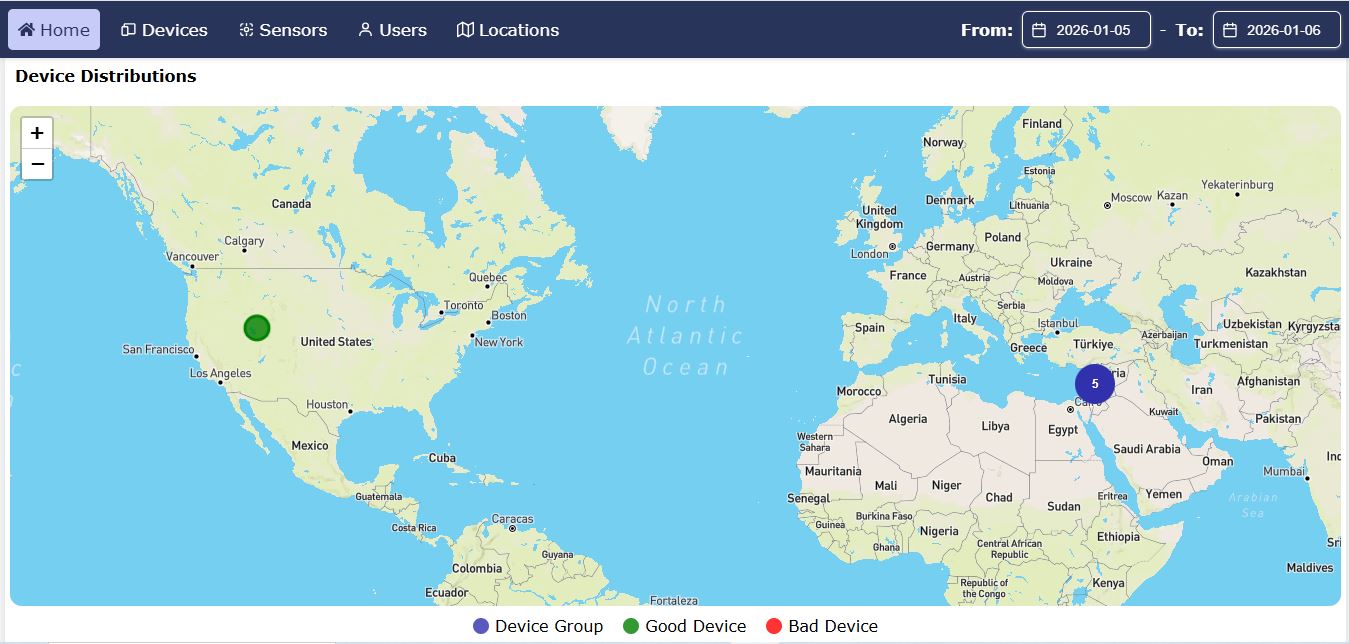 |
Map View Displays all devices on an interactive map with color-coded status indicators. Users can click any device to view its sensors, real-time values and historical data. |
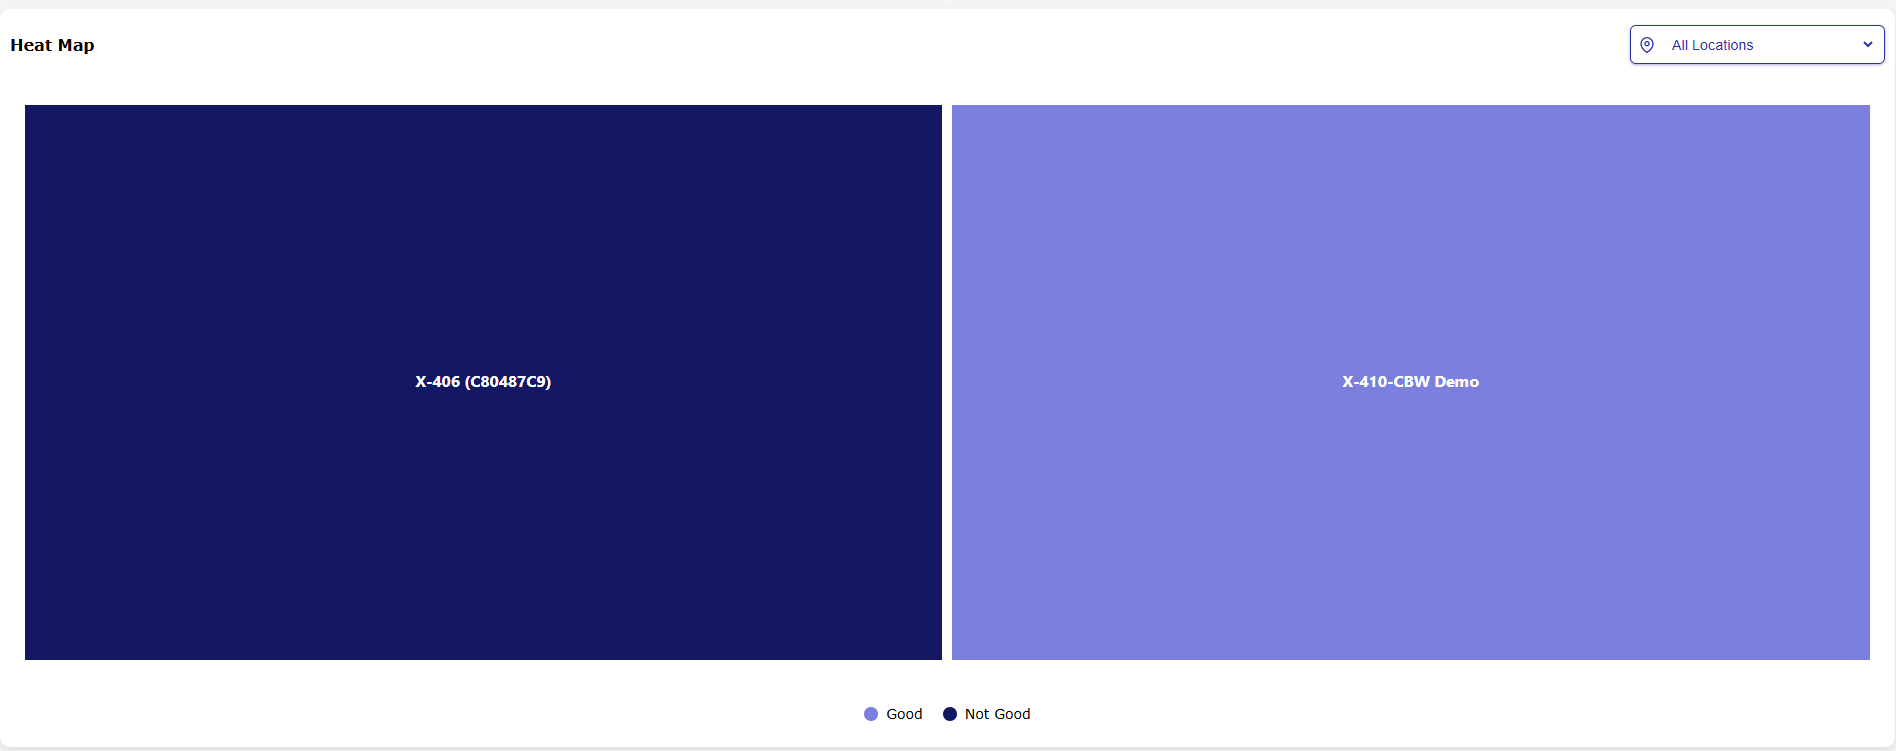 |
Heat Map |
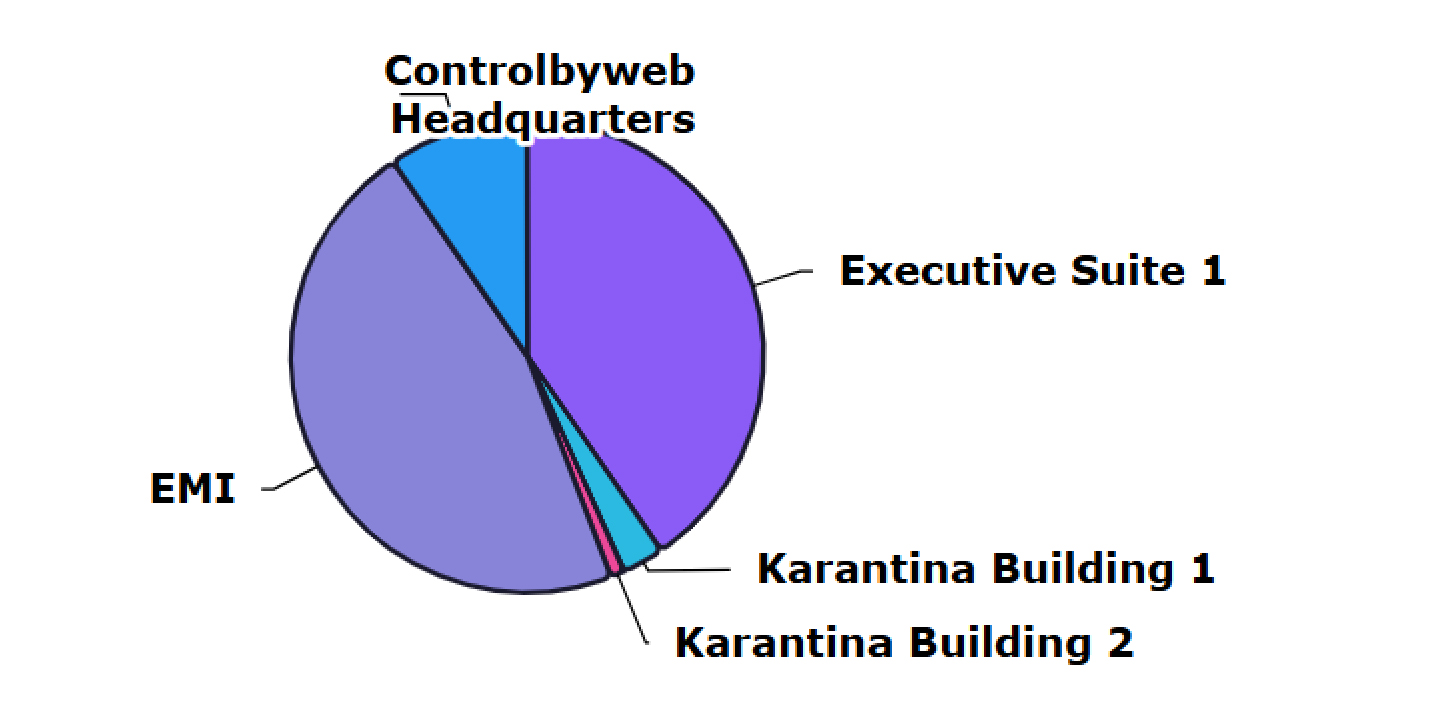 |
Pie Chart |
|
|
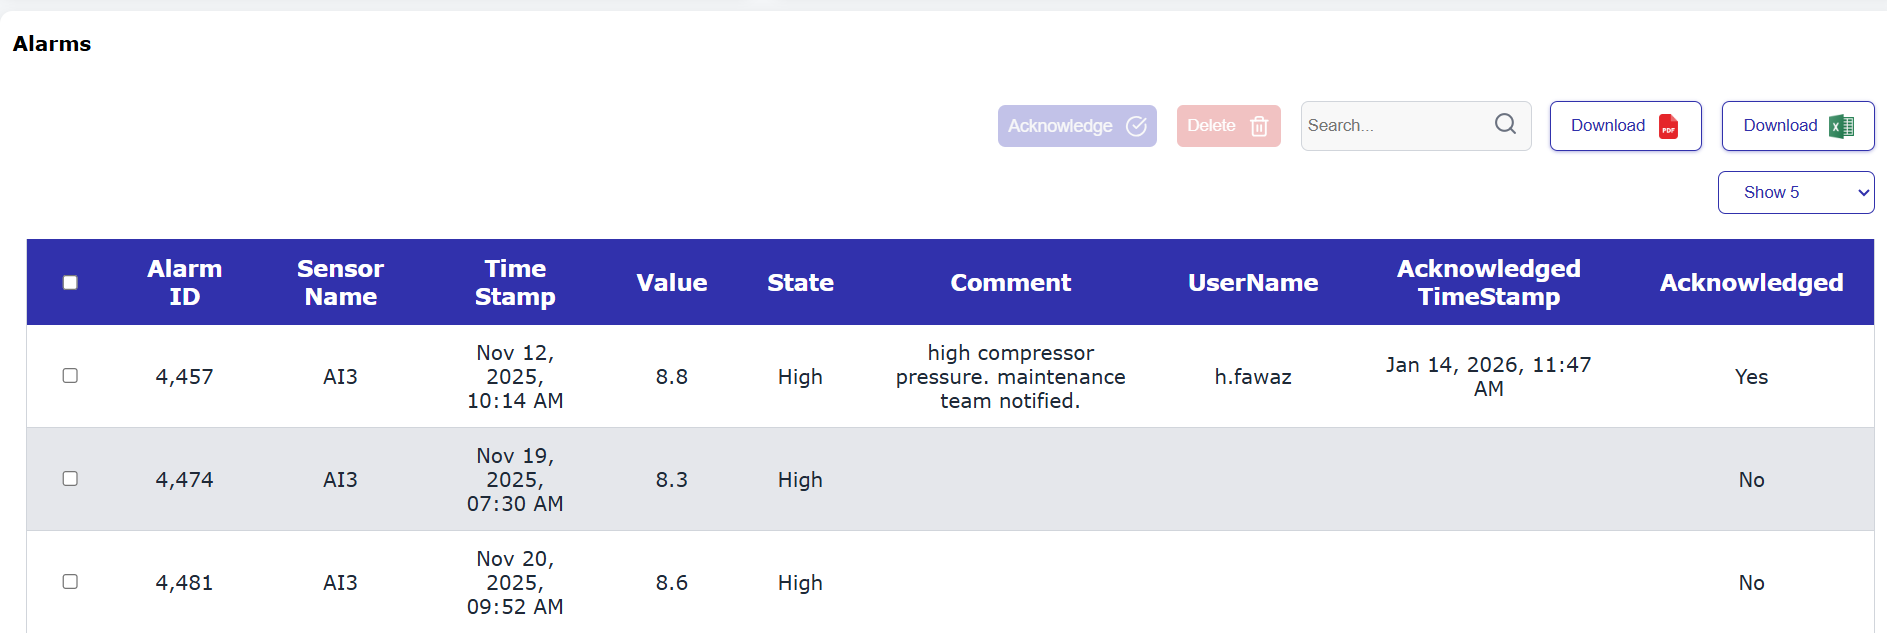
Alarms Acknowledgment |
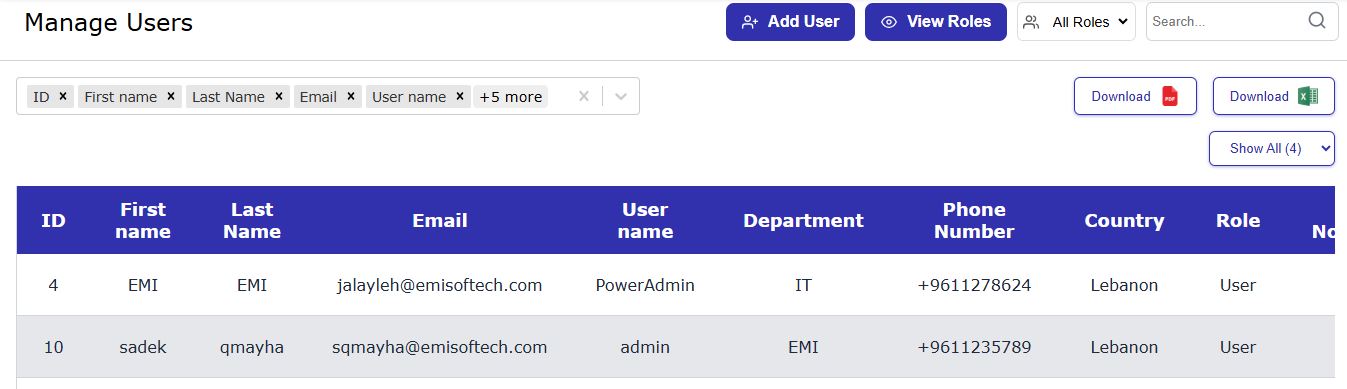 |
Role-Based User Management |
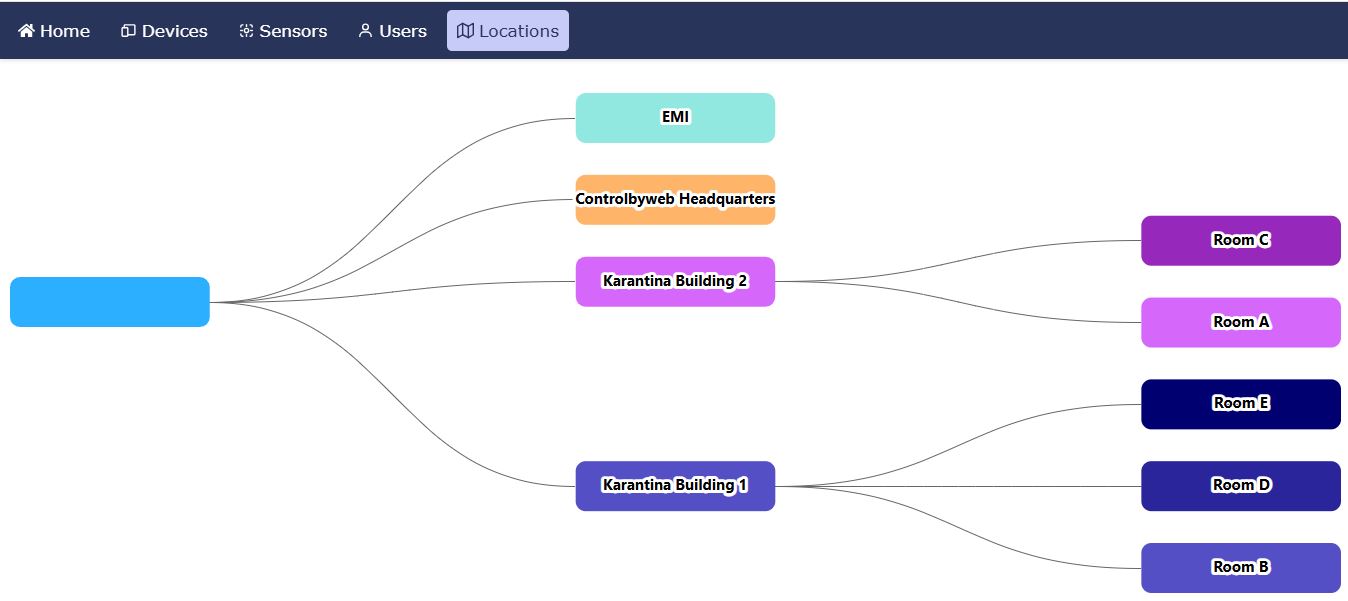 |
Locations & Multi-Level Sub-Locations |
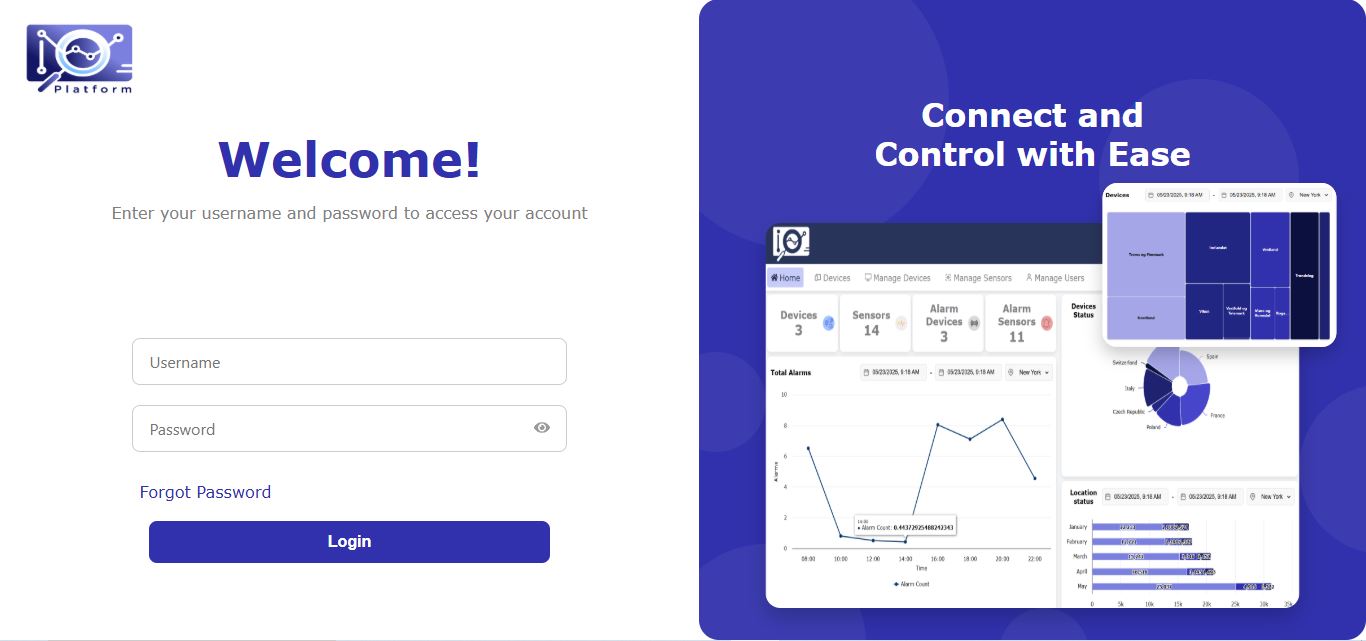 |
Secure Login |
 |
Export to Excel and PDF |
|
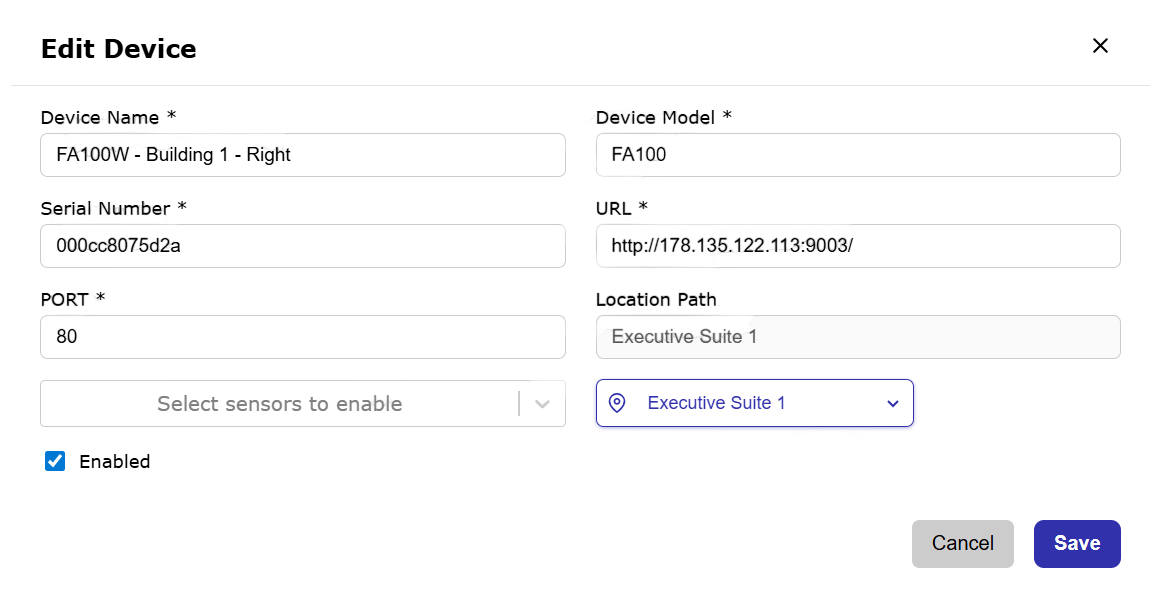
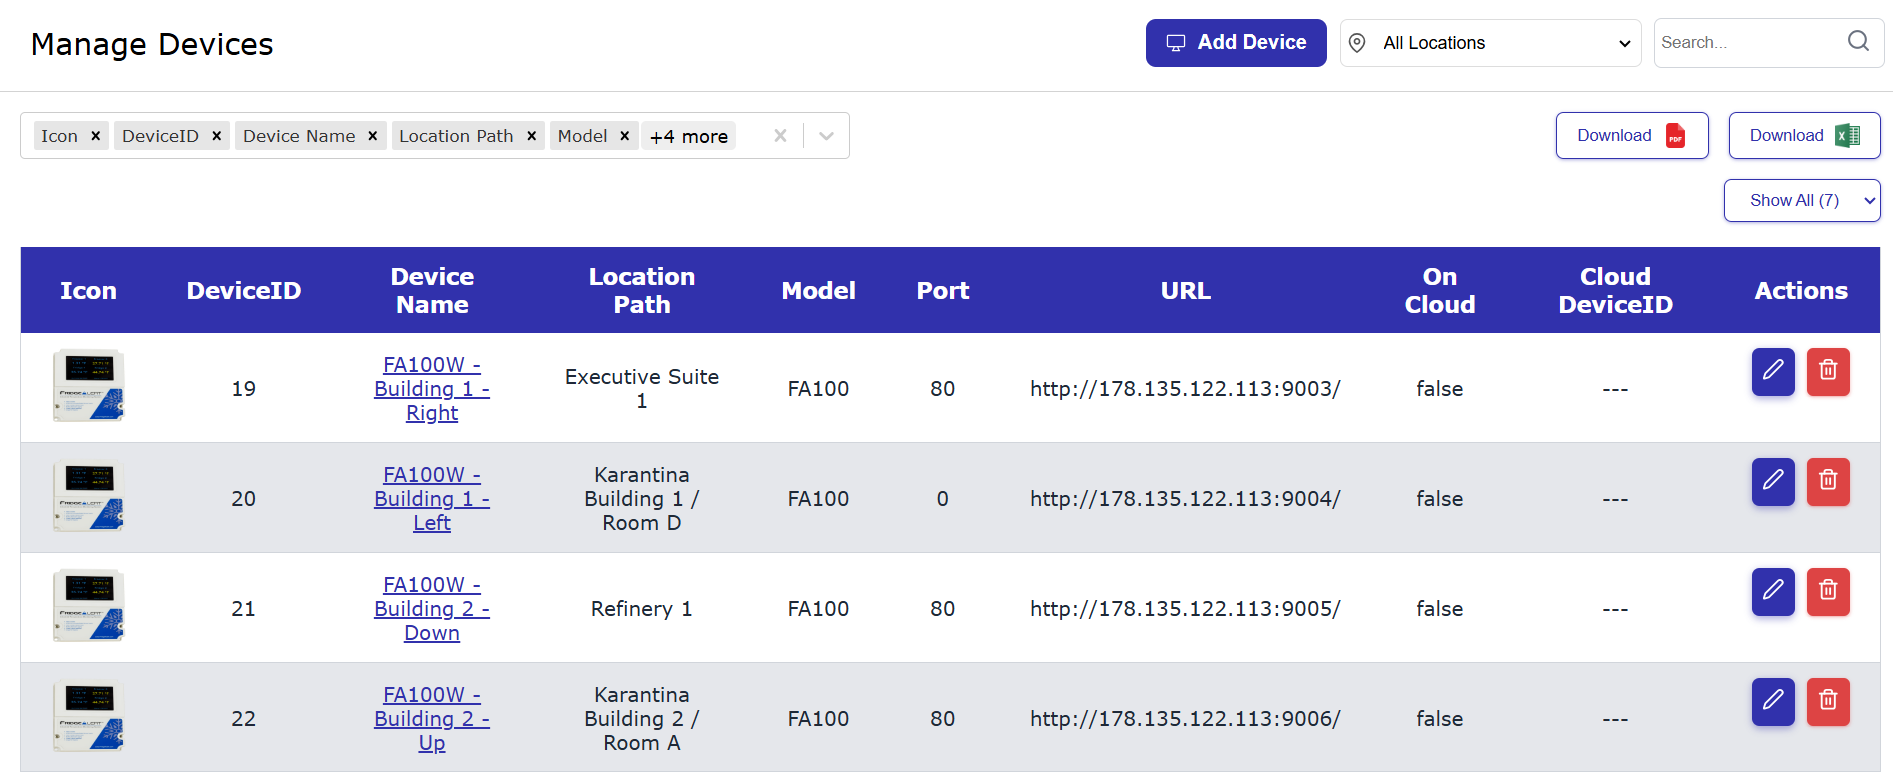
Manage Devices and Assign Them to Locations Allows admins to create, edit, and delete devices and link each one to a specific location. Ensures accurate organization and tracking of all assets. |
 |
 |
|
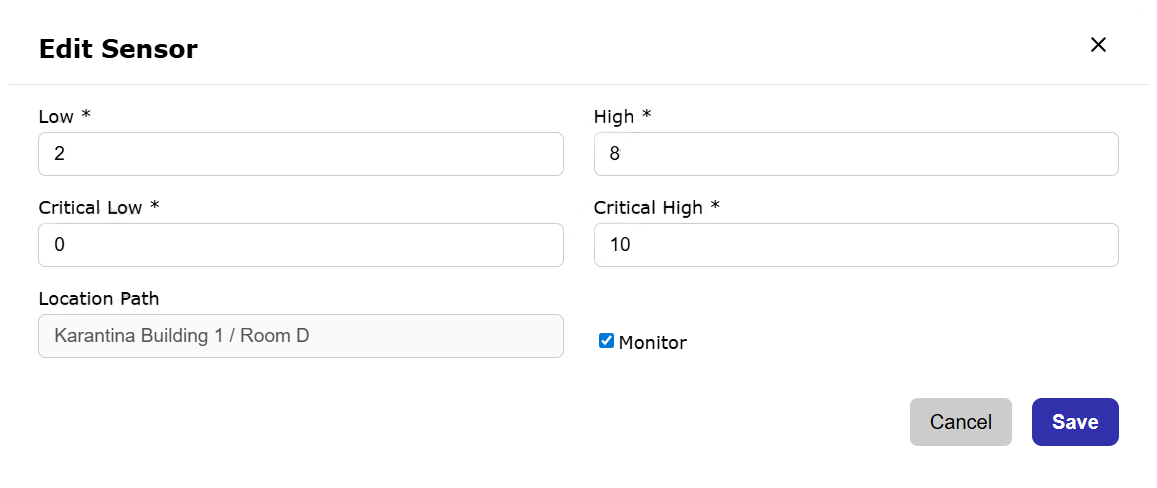
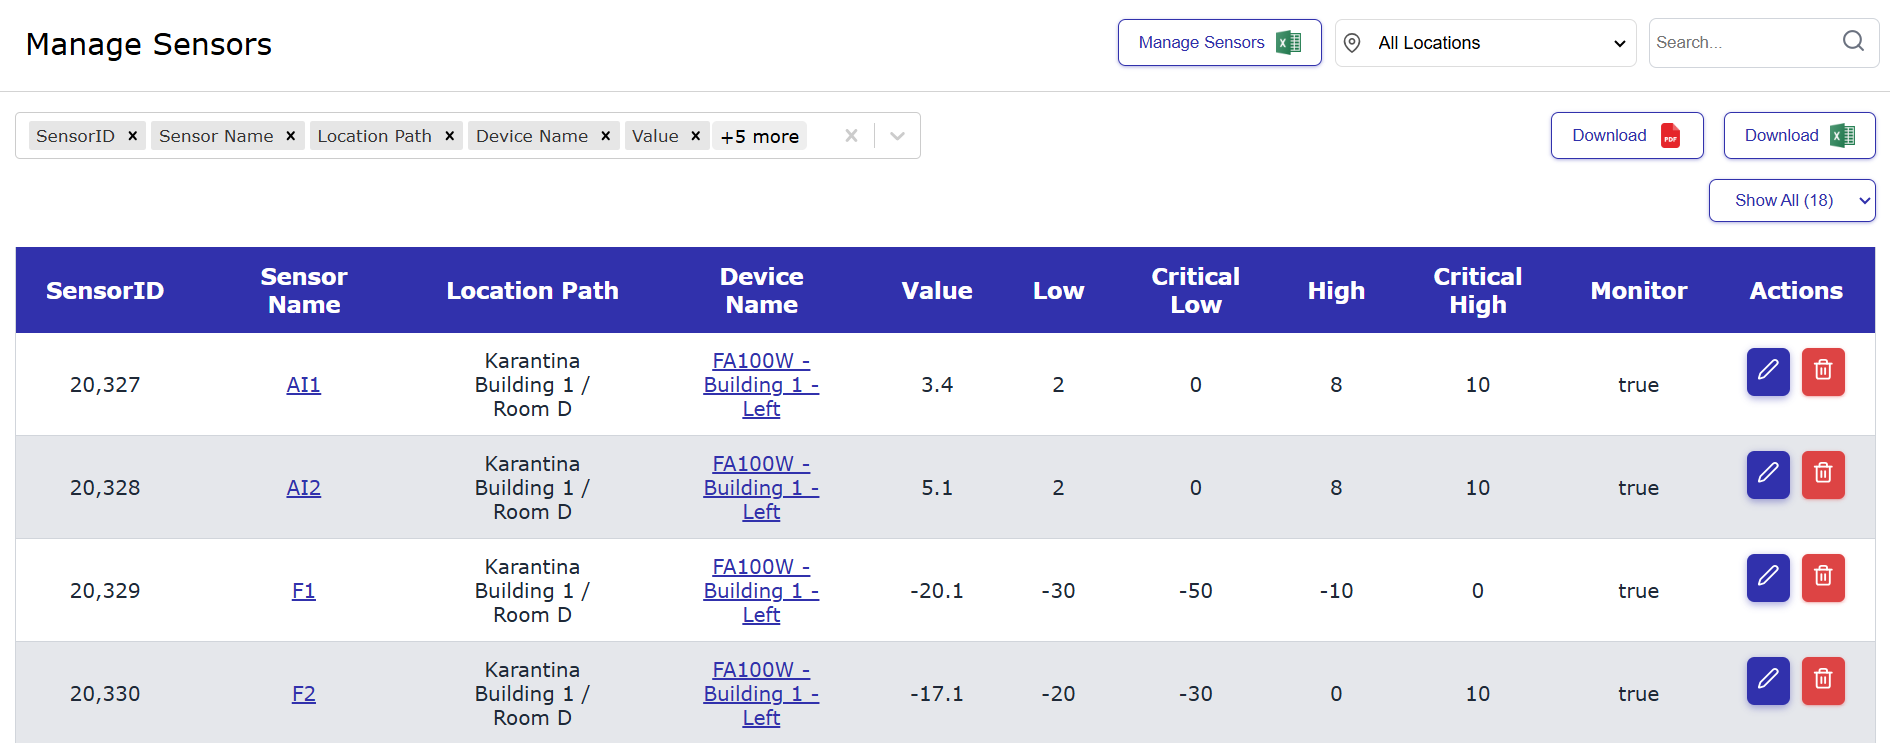
Manage Sensors, Thresholds, and Monitoring Admins can configure sensors, adjust thresholds, and enable or disable monitoring. This provides full control over sensor behavior and alert conditions. |
 |
 |
Streamline Your Operations with IOPlatform
Integrate Your ControlByWeb Devices Today!With IOPlatform, users can streamline operations, set up alerts, automate responses, and ensure that critical data is accessible and actionable from anywhere, enhancing efficiency and decision-making across diverse applications
Features
Manage users such as user groups, logins, roles, and permissions
System Menu
Home page: General overview of all the devices and sensors across all locations
Device view: A summary table of the device attributes (Model number, Serial number, IP Address, Location, number of sensors connected)
Manage devices: The capability to edit devices (add, remove, change IP Address)
Manage sensors: Table summary of all sensors and associated attributes with the ability to set alarm thresholds
Manage users: Can be accessed by admin in order to assign different roles to users
Reporting and export feature: The ability to export all devices and sensors information to PDF and Excel