
|
|

| Interactive Dashboards | |||
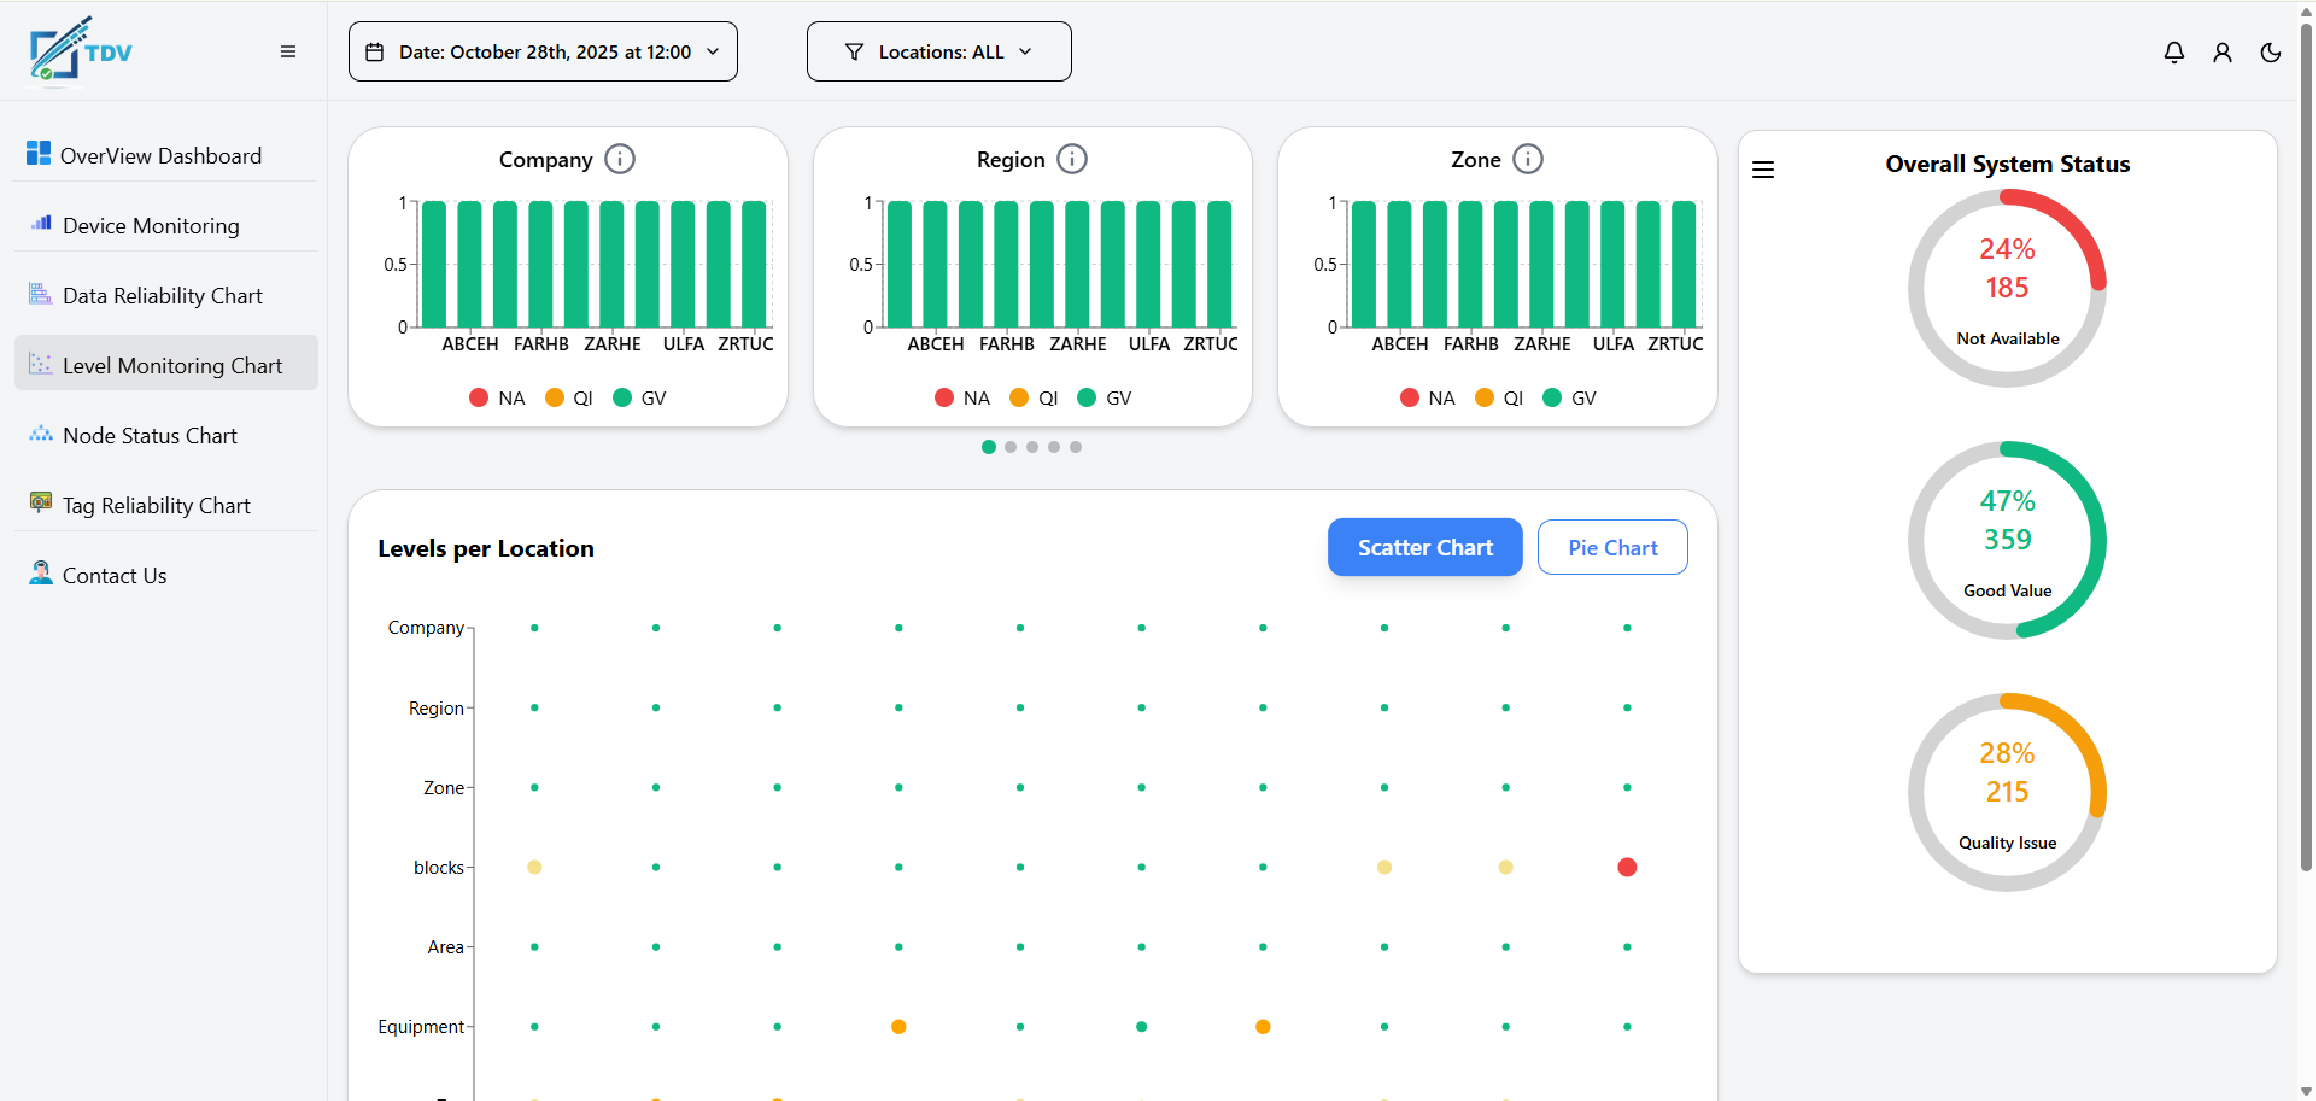 |
Level Monitoring Bubble Chart Shows issue magnitude across locations with bar charts for the first three levels. |
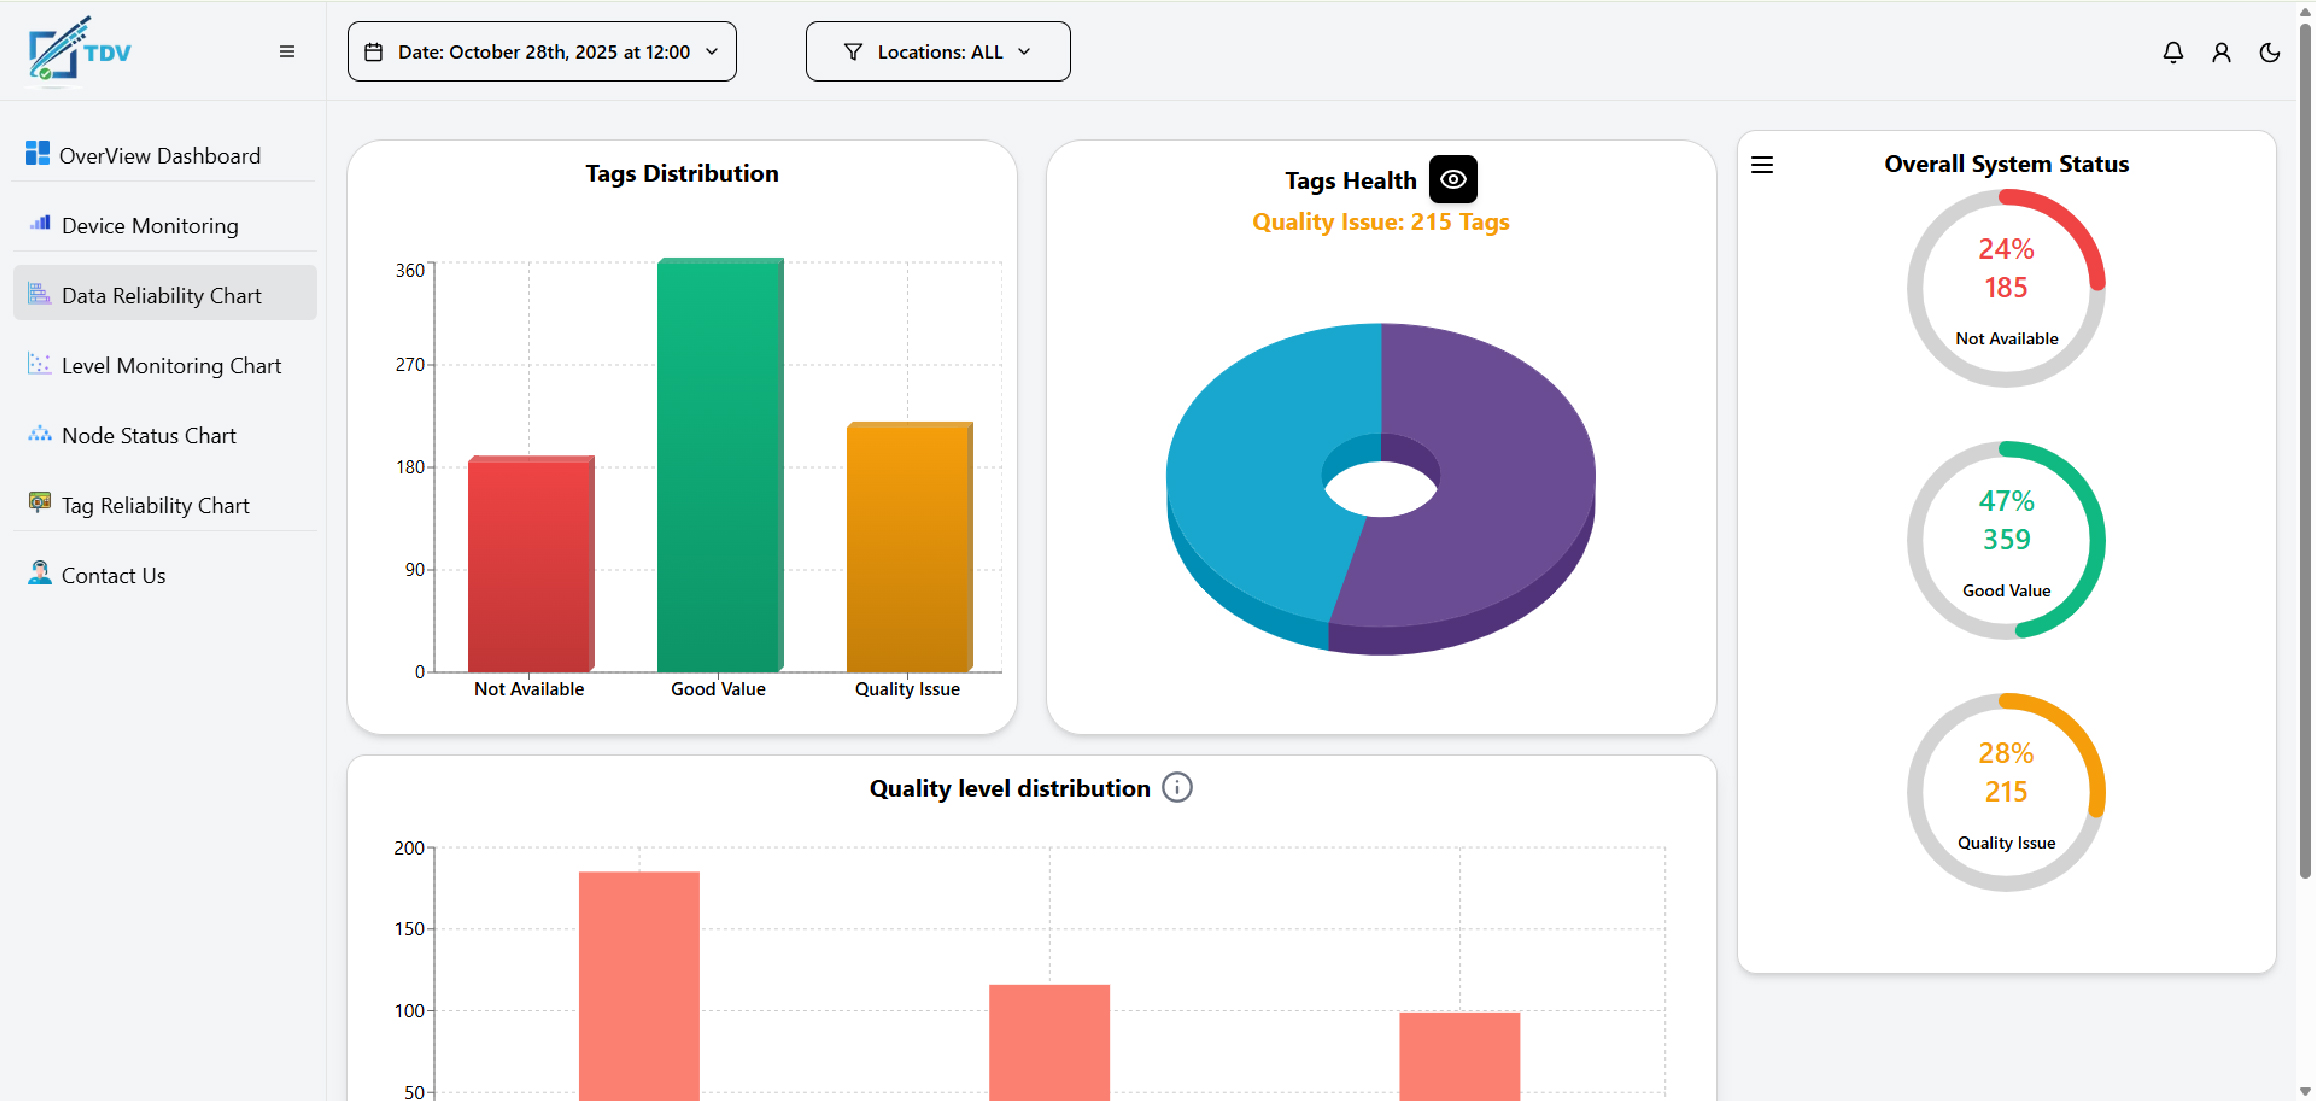 |
Data Reliability KPI Displays the overall data reliability KPI with error location & details charts, allowing users to drill down, group, & export data. |
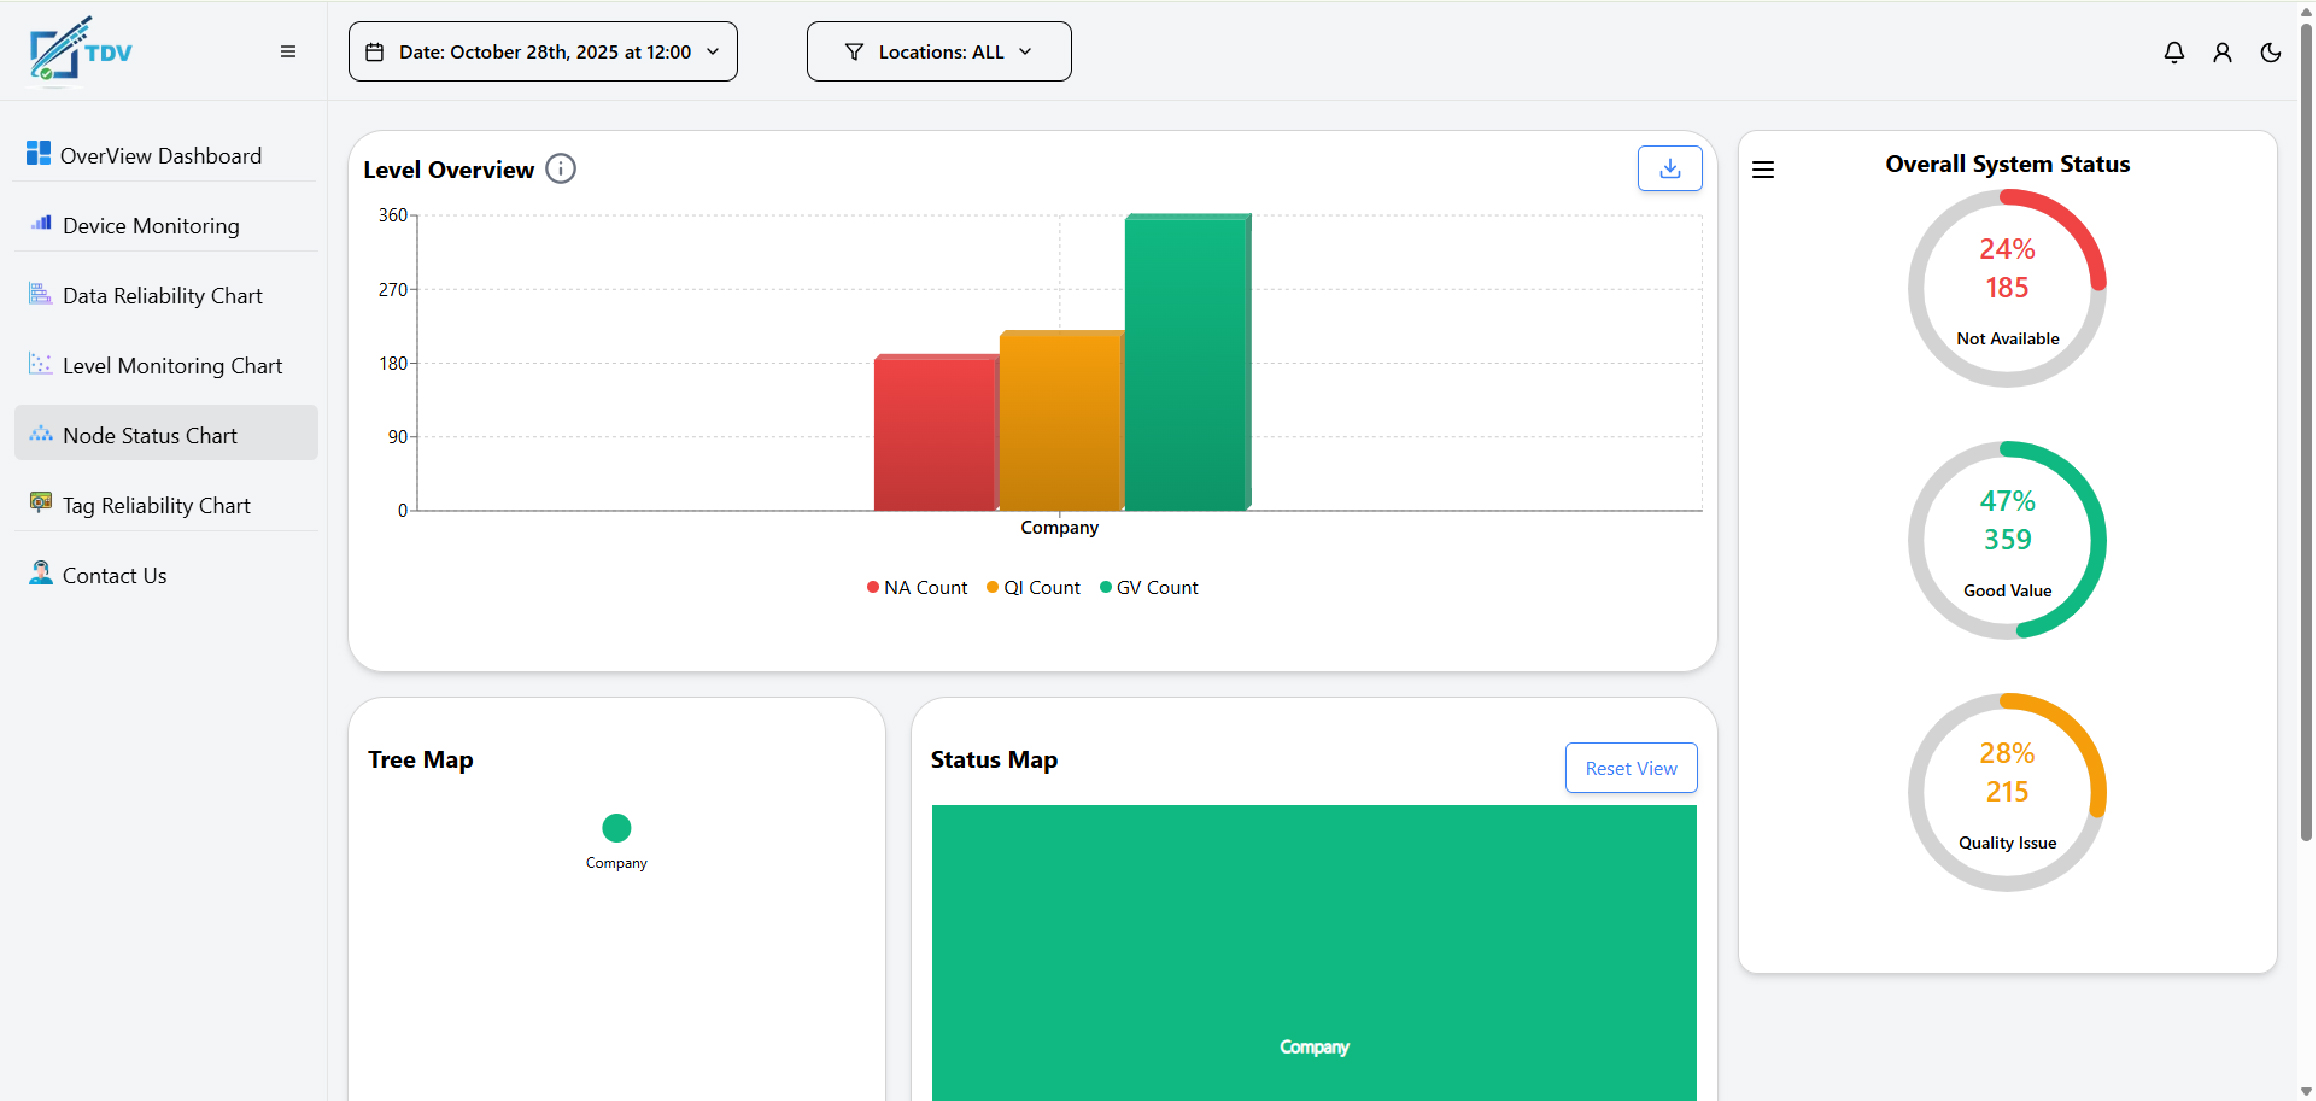 |
Node Status Chart Shows the status of elements, with the ability to drill down from the highest level to the tag level. |
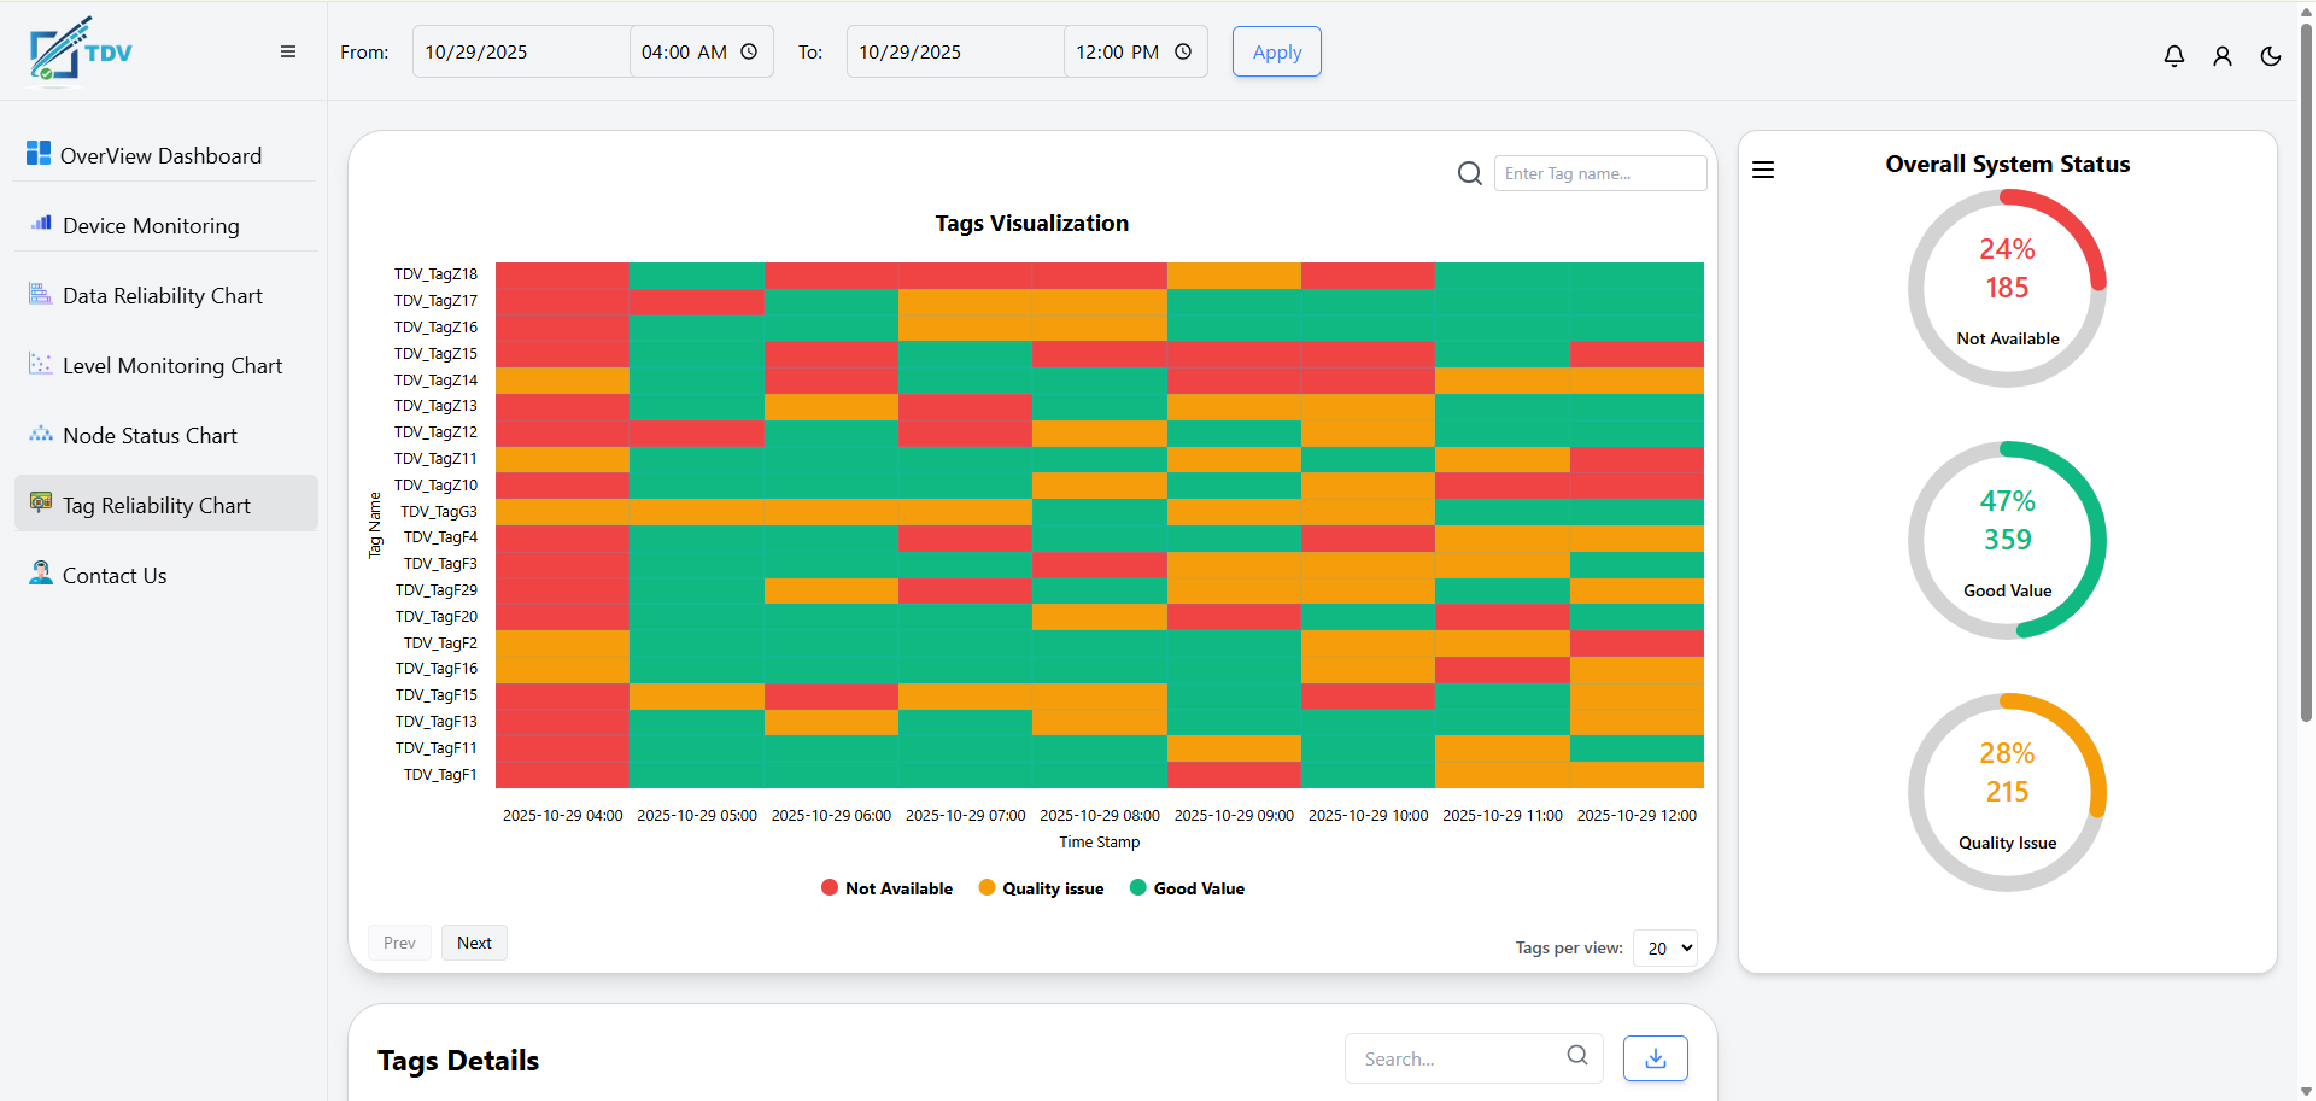 |
Tags Reliability Heat Map View Illustrates the reliability of data over time, aiding users in selecting optimal periods for analysis. |
How TDV Excels in Data Quality
TDV offers a set of sophisticated functionalities that are extremely useful in fault detection and root cause analysis:
Through Validation: Captures and validates each value received by the PI Server against a set of provided quality check rules.
Data Flagging: Flags values that do not pass quality checks in the PI Data Archive.
Take Control of Your Data – Try EMI TDV Today!
Gain full control over your data quality with EMI TDV. Try it now to see how you can easily validate and analyze your data for better decision-makingTDV strengthens your data's reliability by using advanced validation techniques and providing in-depth analysis through intuitive dashboards, ensuring data authenticity
Features
Annotated Questionable Values: Provides reasons for marking values as questionable in the PI Data Archive.
Hourly Averages Calculation: Calculates hourly averages for equipment or assets, excluding bad and questionable values.
Real-Time Synchronization: Synchronizes your AF database with relational data stores (SQL, Oracle, MongoDB).
Backfilling Tools: Supports backfilling to reconstruct historical data gaps.
Real-Time HTML5 Charts: Offers interactive charts with zooming and panning capabilities.
Fast Data Retrieval: Ensures extra-fast data retrieval using MongoDB.
REST Services: Exposes the system as REST services for third-party integration.
Flagged data include
Solution areas
Data Conditioning & Analysis: Improving the quality and analysis of data.
Predictive Asset Analytics: Supporting predictive analytics by ensuring data quality.
Digital Transformation: Facilitating digital transformation initiatives through reliable data.
Data Quality Issues
Having Data Quality Issues?
Data Quality Technology Stagnation
What Corporations Believe