
|
|
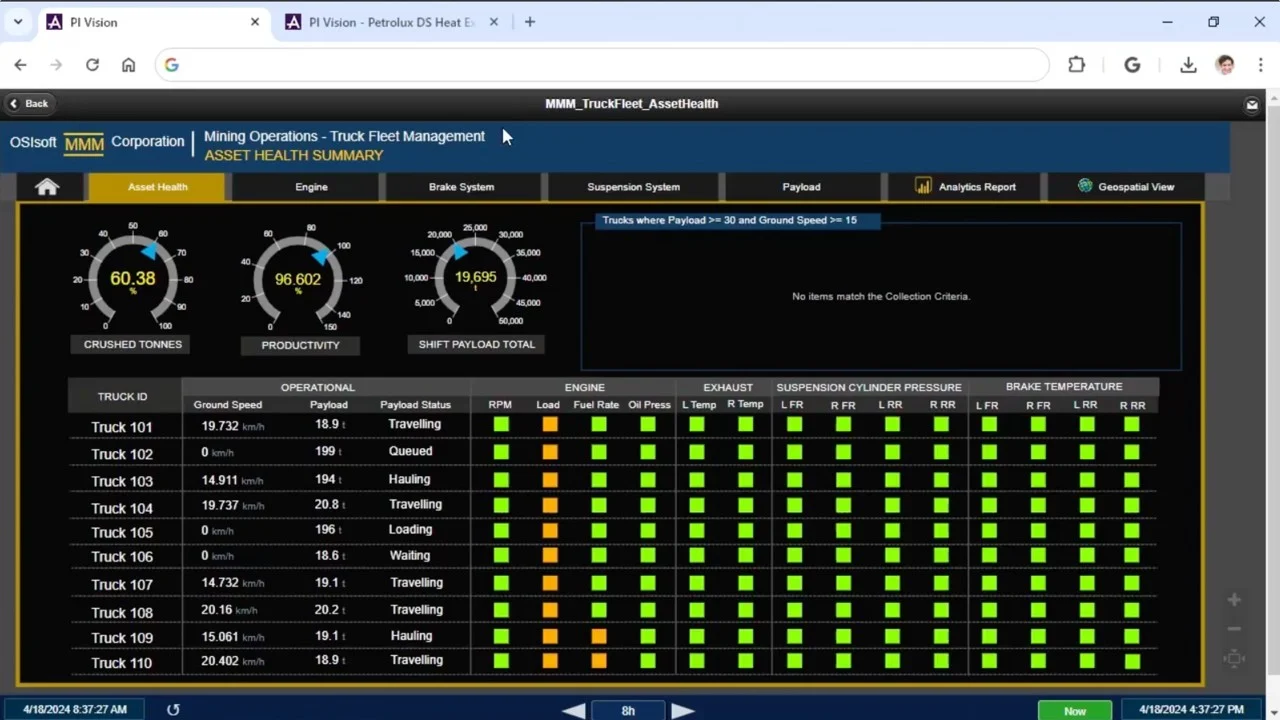
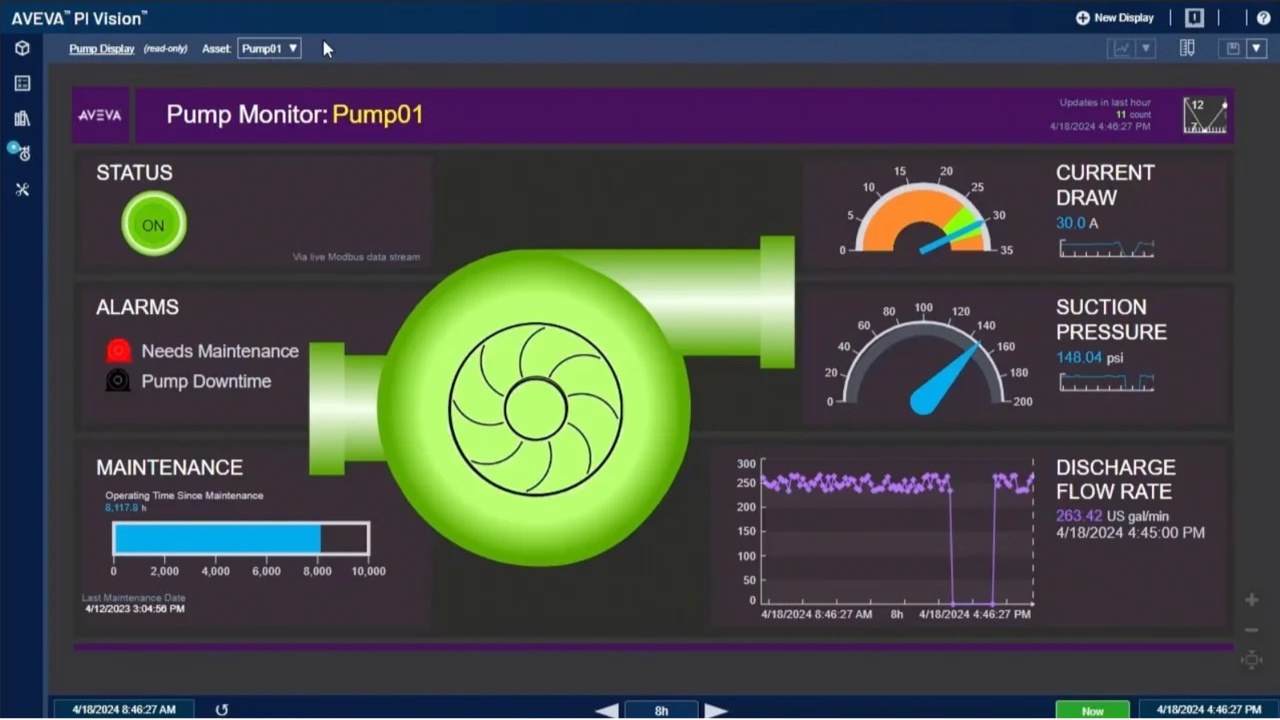
What is AVEVA PI Vision? AVEVA PI Vision is a web-based display and dashboard building tool. Users can easily build configurable visualizations of their real-time operations data without programming or domain knowledge. |
| 25 Of the top 25 pharma companies use AVEVA PI Vision |
500,000 People worldwide use AVEVA PI Vision |
15,000 AVEVA PI Vision users at a major pneumatic manufacturer oversee production monitoring |
9 Of the top 10 mining companies use AVEVA PI Vision |
| Benefits |
||
| Real-time operational visibility | Gain instant self-service access | Create consistent views |
| Explore complex data seamlessly through intuitive interfaces, dynamic displays, and smooth navigation for fast issue resolution | Access critical data instantly with drag-and-drop displays and mobile-ready tools that deliver rapid insights anywhere. | Streamline information delivery with organized displays, rapid rollout, and unified layouts for clear, consistent operations. |
| Features | ||
 |
 |
 |
|
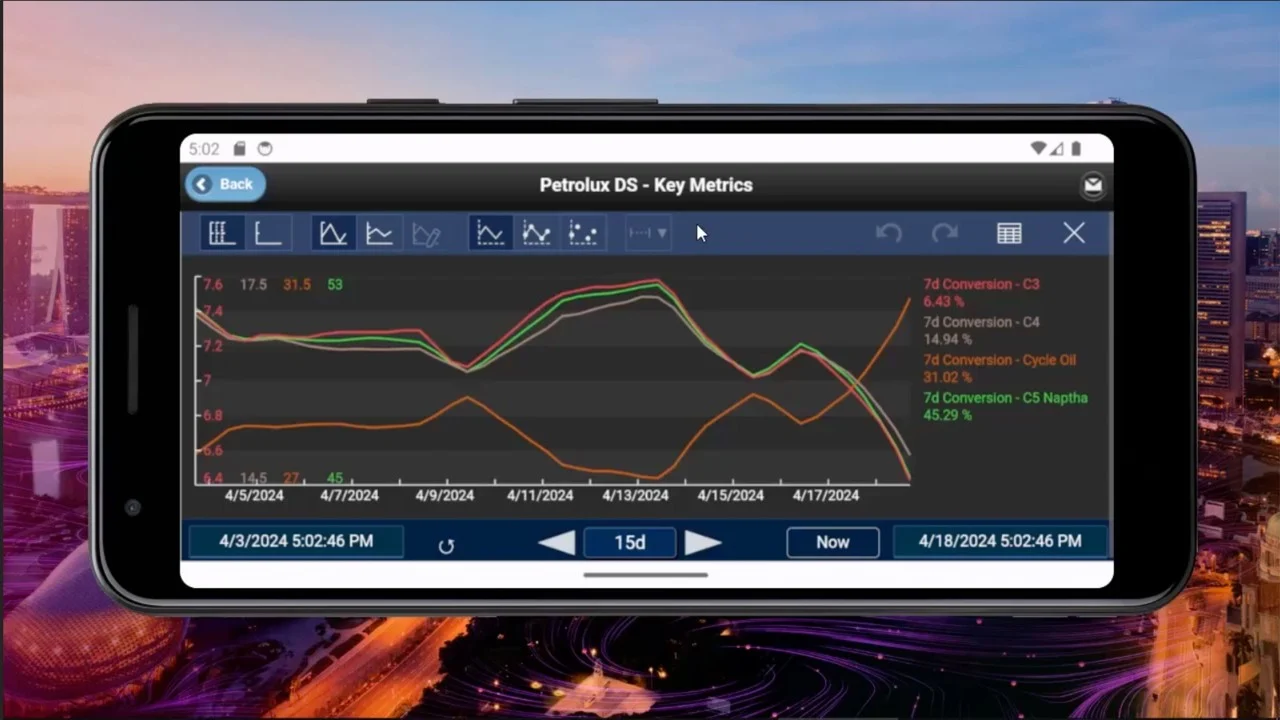
Real-time operational visibility |
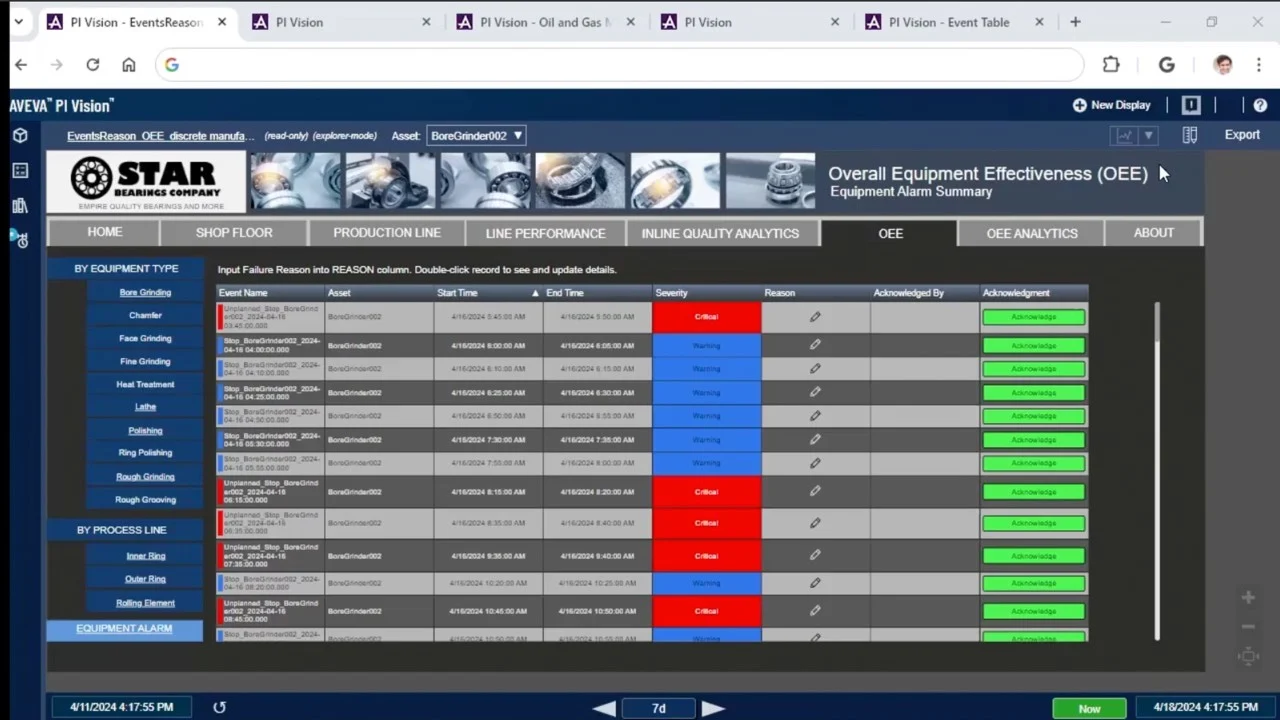
Real-time process alerts |
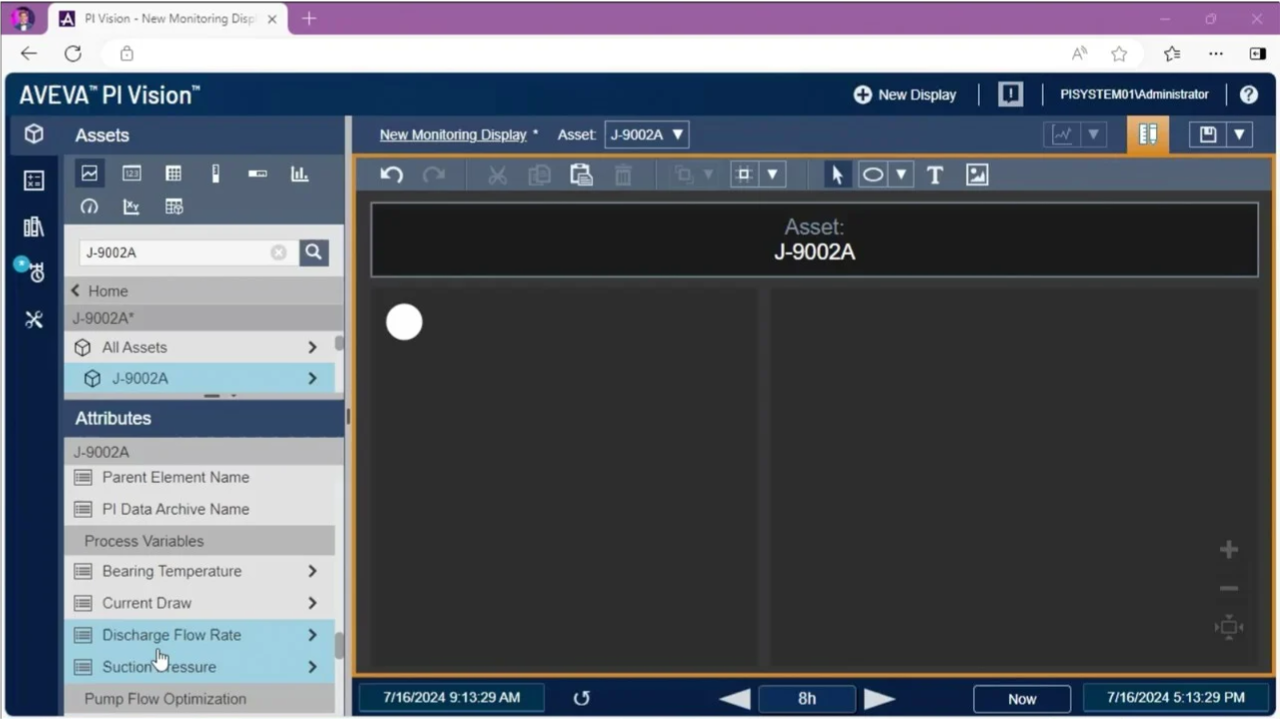
Drag-and-drop display creation |
 |
 |
 |
| Data protection and security Protect industrial data with secure access controls, encrypted communication, and user permissions that ensure only authorized personnel view sensitive information. |
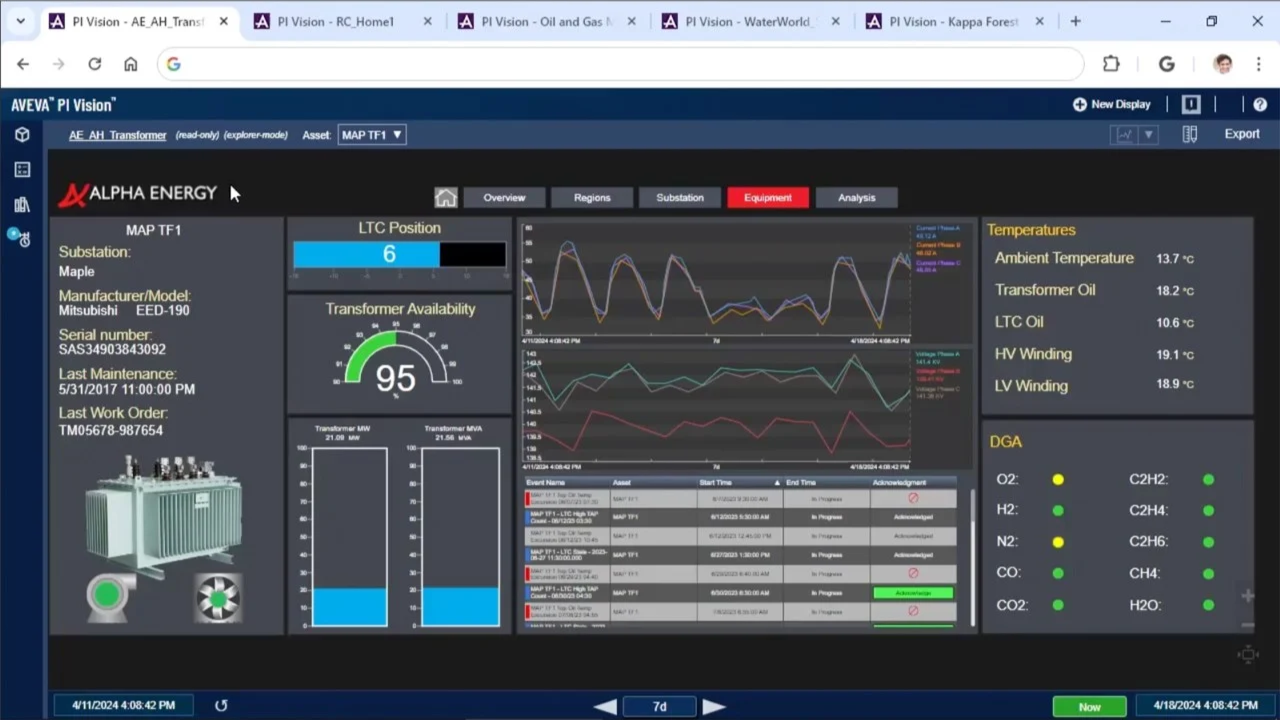
Analyze trends Capture and compare live data from multiple sources, evaluate performance trends in real time, and troubleshoot operational issues without predefined dashboards. |
Context-driven data collections Organize similar assets into logical groups for filtering and automatic updates, creating focused dashboards that simplify analysis and improve visibility. |
| How you can use AVEVA PI Vision? | |
| Build standard data visualization templates | Give every employee access to the same data views that experienced engineers use. Save custom-built visualization templates in a repository for others to use. Dashboards automatically update as new data is received. |
| Improve situational awareness | Use intuitive dashboards to monitor real-time health, safety and environmental conditions. Set up automatic alerts to enable faster decision-making during critical events. |
| Foster cross-discipline collaboration | Deliver real-time data visualizations to team members in different locations on their choice of device. Consistent views facilitate collaboration and support faster decision making. |
Unlock the Power of Your Data!
Experience the full potential of your operations with PI Vision. Start visualizing insights and improving decision-making today!PI Vision transforms your ability to visualize data through intuitive drag-and-drop tools. Create impactful displays quickly and share them effortlessly with just a hyperlink. Access real-time data on any device, enhancing your process monitoring in a modern environment